




Key Takeaways
- Over the past three years, variable incentive opportunities for S&P/ASX 100 CEOs have risen on both an average and median basis.
- However, the rise has not been evenly distributed, with top-end packages pulling further ahead while the broader market remained largely stable.
- This pattern is specific to large-cap companies. The broader S&P/ASX 300 showed neither the same top-end skew nor the same upward trend.
- Benchmarking is driving this trend, and in particular the practice of including international companies in the peer comparison group.
- While high-opportunity packages are intended to align executive interests with shareholders, in practice, the downside risk is typically more contained than the structure implies.
Over the past three years, variable incentive opportunities as a percentage of fixed remuneration for chief executives on the S&P/ASX 100 have risen on both an average and median basis. However, the movement has not been evenly distributed across the group.
The increase was concentrated at the top. Opportunity at the 90th percentile rose by 50 percentage points over the last three years, with the bulk of the increase occurring in 2025 (Figure 1). The median rose by just 9 percentage points, while the 10th percentile barely moved. As a result, the gap between the highest-paying companies and the rest of the market has widened, with top-end packages pulling further ahead while the broader market remained largely stable.
Figure 1. S&P/ASX 100 CEO Total Incentive Opportunities
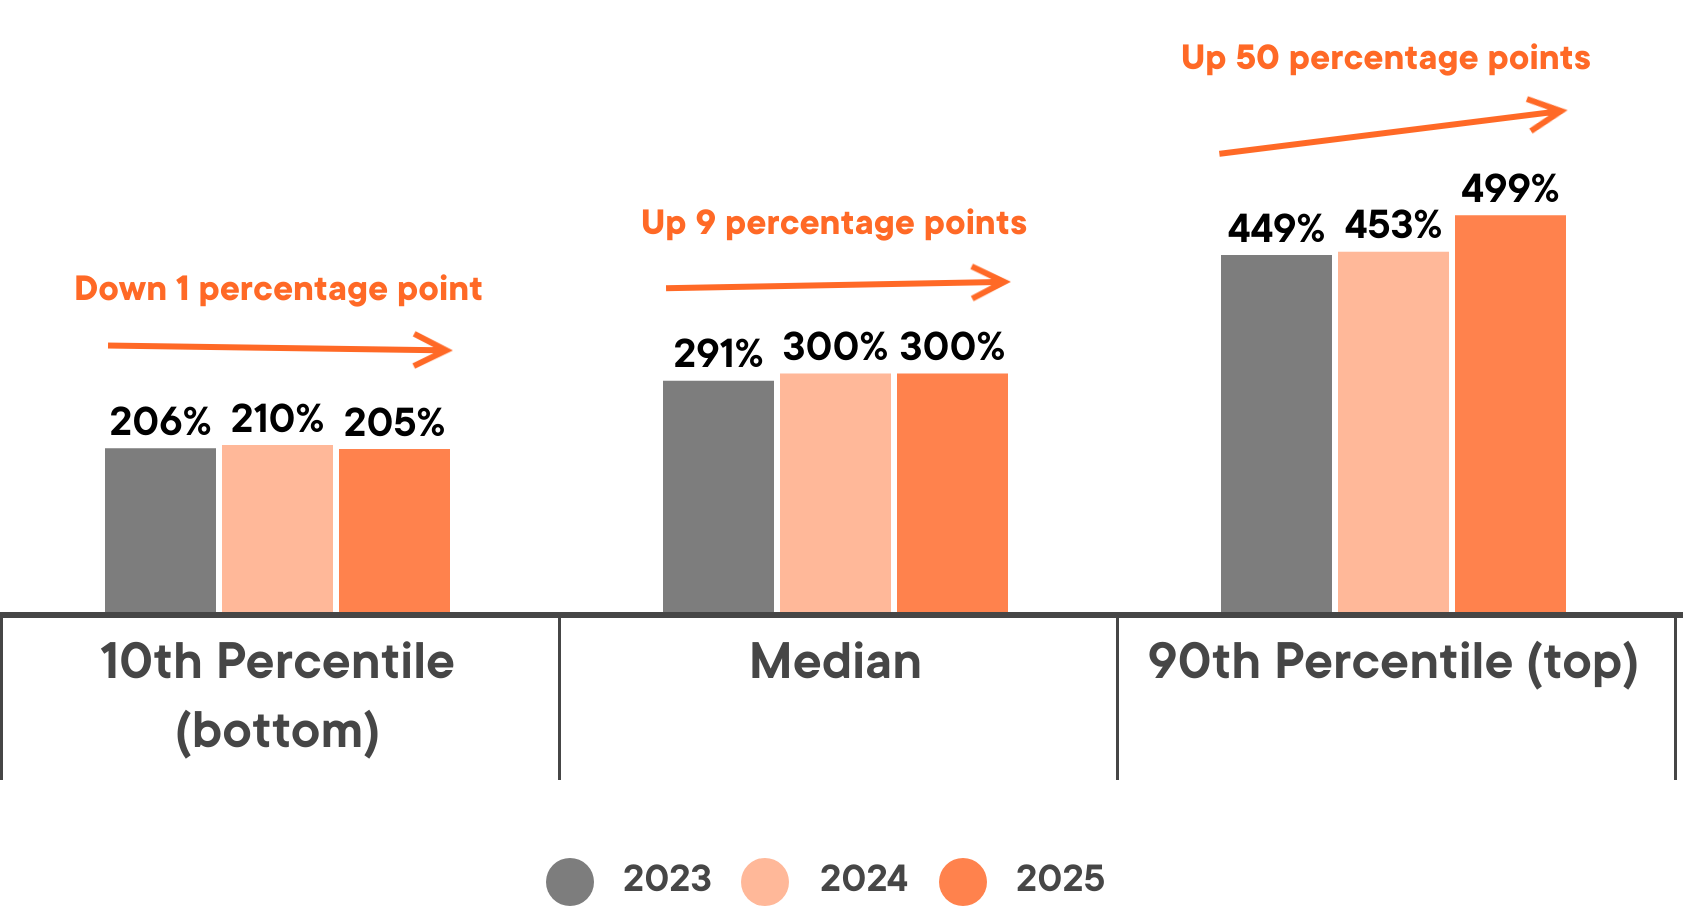
Source: Glass Lewis Research. S&P/ASX 100 as of the September rebalance each year.
This pattern is more commonly observed among large-cap companies . Across the S&P/ASX 300, median total opportunity sat well below that of the S&P/ASX 100 (at 235% for FY2025), with neither the same top-end skew nor the same upward trend. This is consistent with several recent examples in which large-cap CEO incentive increases have drawn market and shareholder attention, and in some cases significant scrutiny. 1,2,3
Table 1 below lists the companies with the largest variable incentive opportunities in the S&P/ASX 100, along with comments on benchmarking. Read together, they point to what is driving the trend: a large proportion of CEOs based outside Australia, and most companies looking at international comparators when benchmarking executive pay.
Table 1. Ranking of Companies With Largest Variable Incentive Opportunities on the S&P/ASX 100

Source: Glass Lewis Research. FY2026 CEO pay packages as disclosed by companies. Includes only companies with primary listing in Australia. Abbreviations denote STI as short-term incentive and LTI long-term incentive. Market capitalization as of each company’s last FY end date. For an extended table showing the full top 20, see here.
The table ranks the ten highest companies by the CEO’s total variable incentive opportunity level. The comparisons are not like-for-like, however, and the ranking should be read with several limitations in mind. Because opportunity levels are expressed as a percentage of fixed remuneration, a relatively low fixed base lifts the ratio regardless of the award's size.
Opportunity level also says nothing about the difficulty of the targets, so a high opportunity may sit behind hurdles that seldom pay out in full. Nor does it capture the form of the award, with cash, options and performance rights carrying different values and risk profiles. Consequently, these figures are best read as an indication of scale rather than a precise ranking.
The data and ranking above focus on regular variable incentive opportunities and exclude one-off awards. For completeness, however, we note one additional company, NEXTDC, with a substantial one-off award that would have ranked close to the top had it been included.
Table 2. NEXTDC CEO’s Variable Incentive Opportunity
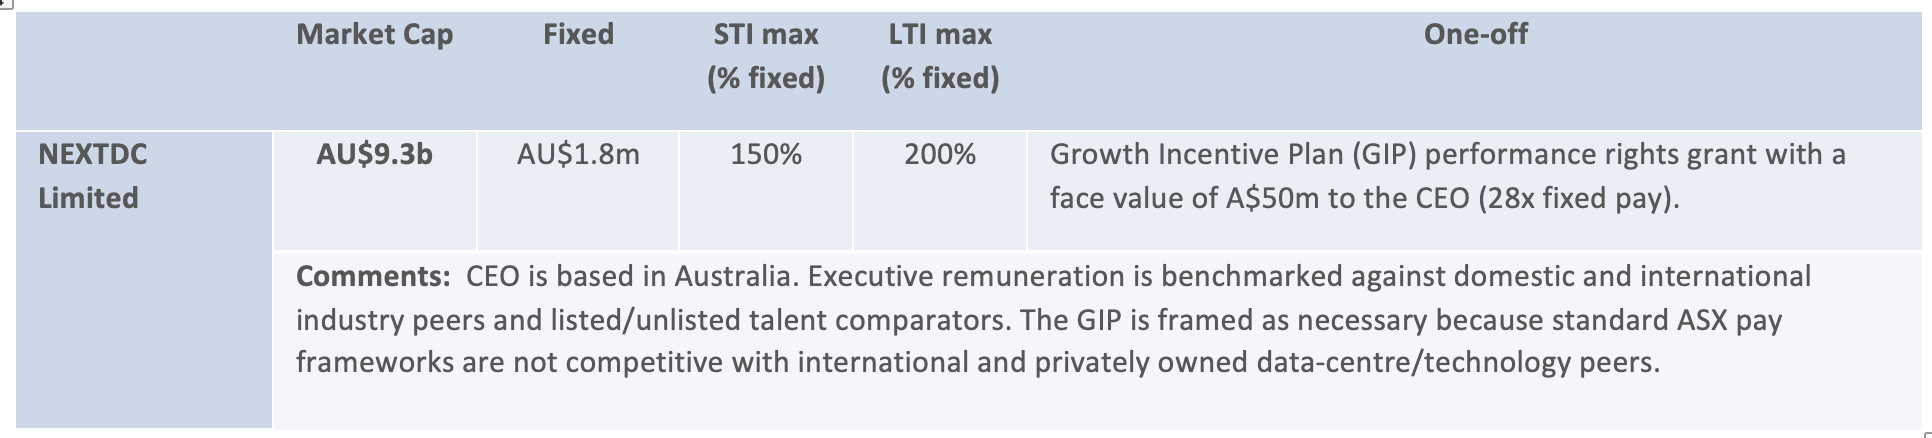
Source: Glass Lewis Research. Note: FY2026 CEO pay package as disclosed by company. Market capitalization as of last FY end date.
The Accelerant: Peer Benchmarking and Comparator Choice
Benchmarking is part of the explanation for this drift. The accelerant often comes from extending the comparison beyond domestic listed peers to higher-paying references – most often international companies, frequently U.S.-based, where prevailing pay is materially higher. Less commonly, the reference extends to unlisted competitors, with NEXTDC's growth incentive plan being the clearest example (Table 2).
Boards we engage with4 often argue that higher opportunity is needed to remain competitive for talent, particularly where the company has global operations and recruits in more competitive, higher-paying markets. This retention risk can be real. The energy sector, for instance, has seen Australian oil and gas executives recruited into higher-paying roles offshore. Even so, claims that suitable talent is scarce are unlikely to be accepted at face value, and investors remain wary of U.S. pay practices becoming increasingly embedded in the Australian market. Retention risk alone is unlikely to ease that concern.
The strength of boards' cases varies. International comparators are easier to justify when there is a clear strategic basis – executives based outside Australia and the bulk of revenue or operations in those markets. Absent a basis like this, a peer group that reaches offshore may read more as a choice of comparator than a reflection of where the company competes for talent.
More fundamentally, benchmarking creates a feedback loop.5 Boards set incentive opportunities by reference to a peer group and aim to pay above the median, which pushes the reference point up each round. Once one company lifts its opportunity, that higher figure enters the next board’s peer data and, over time, the levels climb whether or not performance justifies it.
The Asymmetry in "At-Risk" Pay
High-opportunity packages are usually defended by boards as "high risk, high reward." Large awards put a meaningful share of pay at risk, thereby aligning executives with shareholders. In practice, however, the risk is rarely symmetrical, and the downside is typically more contained than the structure implies. When executive outcomes disappoint, boards often come under pressure to retain and re-motivate executives.
Australian investors have seen boards responding in such cases by resetting targets, applying discretion to vesting, re-striking awards at a lower price, and adding retention grants. Limiting downside risk while leaving upside intact weakens the pay-for-performance case used to justify the quantum. Once executives come to expect that cushioning, it can encourage more risk-taking than shareholders would choose.
Board Ownership of Remuneration Decisions
Ultimately, remuneration should not be set in isolation from the market. Market reference is best treated as an input, not a default. It falls to the board and remuneration committee to interpret benchmarking outcomes and determine the quantum and structure best suited to the company's and individual's circumstances.
Companies are likely to face scepticism where international benchmarking is used to inflate executive pay without demonstrating that it reflects the actual talent pool and retention risk at hand. Where that reasoning is set out transparently, investors can determine whether a higher opportunity is reasonable.
Notes and References
1 Macdonald-Smith, Angela. "Shareholder stoush brews over generous Woodside CEO bonus plan." Australian Financial Review. April 10, 2026. https://www.afr.com/companies/energy/proxy-adviser-slams-woodside-ceo-pay-package-as-too-generous-20260409-p5zmmi
2 Bennett, Tess and McGuire, Amelia. "Shareholders rebuke NextDC for CEO’s $112m bonus plan." Australian Financial Review. November 13, 2025. https://www.afr.com/technology/nextdc-shareholders-deliver-strike-against-ceo-pay-20251113-p5nf35
3 Bennett, Tess. "Xero suffers symbolic shareholder strike against executive pay." Australian Financial Review. August 21, 2025. https://www.afr.com/technology/xero-suffers-symbolic-shareholder-strike-against-executive-pay-20250820-p5moit
4 Blaney, Cindy. "Stewardship in Action: Engagement Snapshots on Executive Pay Incentives and Peer Groups." Glass Lewis. May 14, 2026. https://www.glasslewis.com/article/stewardship-in-action-engagement-snapshots-on-executive-pay-incentives-and-peer-groups
5 Glass Lewis. "Avoiding Pitfalls in Peer Group Selection and Executive Pay Benchmarking." August 26, 2024. https://www.glasslewis.com/article/avoiding-pitfalls-in-peer-group-selection-and-executive-pay-benchmarking



.jpg)
