Analyzing Board Composition in the US: What the Latest Data Says on Director Independence, Commitments and Diversity
Subscribe


Key Takeaways
- Compared to 2024, there were slight increases in board independence (77.5%) and the presence of an independent chair (44.9%)
- In response to ongoing shareholder concern regarding the substantial increase and scope of directors’ responsibilities and oversight, the number of issuers implementing policies limiting director commitments continued to rise, with 75% of companies within the Russell 1000 having such policies.
- Although the overall number of women on Russell 3000 boards increased slightly in 2025 to 30.6%, the number of gender diverse, first year appointments at Russell 3000 companies decreased from 35% in 2024 to 28.4%.
- There was a significant decrease in the number of companies within the Russell 1000 that disclosed the racial/ethnic diversity of directors on either the aggregate board or individual director level (approximate 24% decrease from 2024).
Over the 2025 proxy season,1 Glass Lewis covered 22,635 director election proposals across 4,237 U.S.-listed companies. More than 1,400 directors were appointed to boards or stood for election for the first time, representing approximately 4.5% of all directors in our coverage. This article provides an overview of the board trends that we observed, covering board independence, overcommitment, and gender, racial and ethnic diversity, and discussion of how these findings align with the results of our 2025 Policy Survey.2
Board and Chair Independence
We observed an increase in board independence (from 77.1% last year to 77.5%) and independent chairs (from 44.4% last year to 44.9%, excluding companies with other independent leadership positions such as vice chair or lead director).3 This may indicate more companies are taking steps to improve their governance practices, including as a result of shareholder proposals to separate board chair and CEO roles. Board size was static, averaging 8.6 directors in both 2024 and 2025.
Director Commitments Based on Number of Boards
The number of directors serving on three or four boards continues to decline, while the number of directors serving on only one or two boards generally remains consistent, as shown on Figure 3. This aligns with increased interest in director commitments and the continued trend of issuers voluntarily implementing policies to ensure their directors are not overcommitted. As of the 2025 proxy season, 75% of Russell companies have a director commitment policy in place.
Figure 1. Number of Public Company Directorships Among Russell 3000 Directors
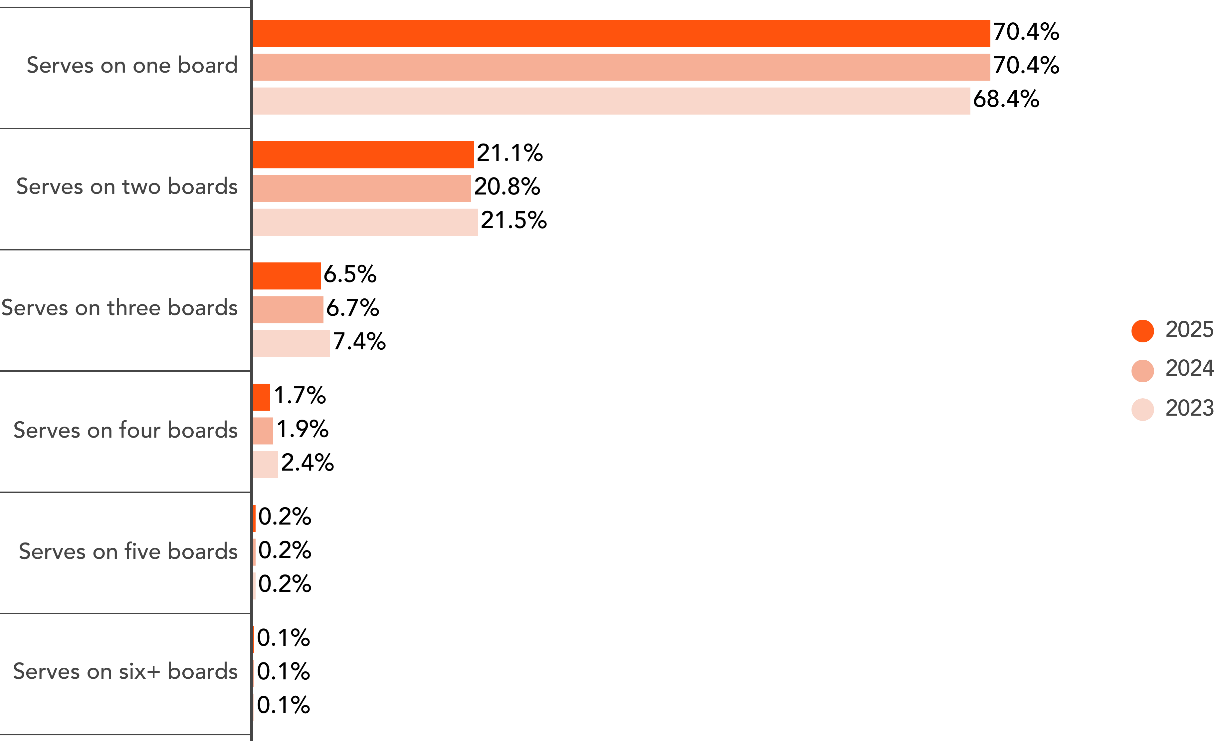
Source: Glass Lewis Research. Data as of the 2025 proxy season period of Jan. 1 to June 30, 2025.
Within the Russell 3000, only five directors serve on more than six boards, down from seven in 2024 and eleven in 2023. However, that does not necessarily mean the practice is gradually fading away. Notably, in 2025, only two of five directors serving on more than six boards were included on the previous year's list (John A. Copelyn, 8 directorships; and Ali Behbahani, 7 directorships), with the other three directors joining the list for the first time (Jeffrey M. Blidner, 8 directorships; William P. Foley II, 7 directorships; and Edward T. Mathers, 7 directorships).
Gender Diversity on Boards of Directors
Gender diversity was down slightly across our total U.S. coverage universe (from 28.2% last year to 27.9%), but up among Russell 3000 companies (from 30.4% last year to 30.6%), as shown in Figure 2 below.
Figure 2. Board Gender Diversity for the Russell 3000
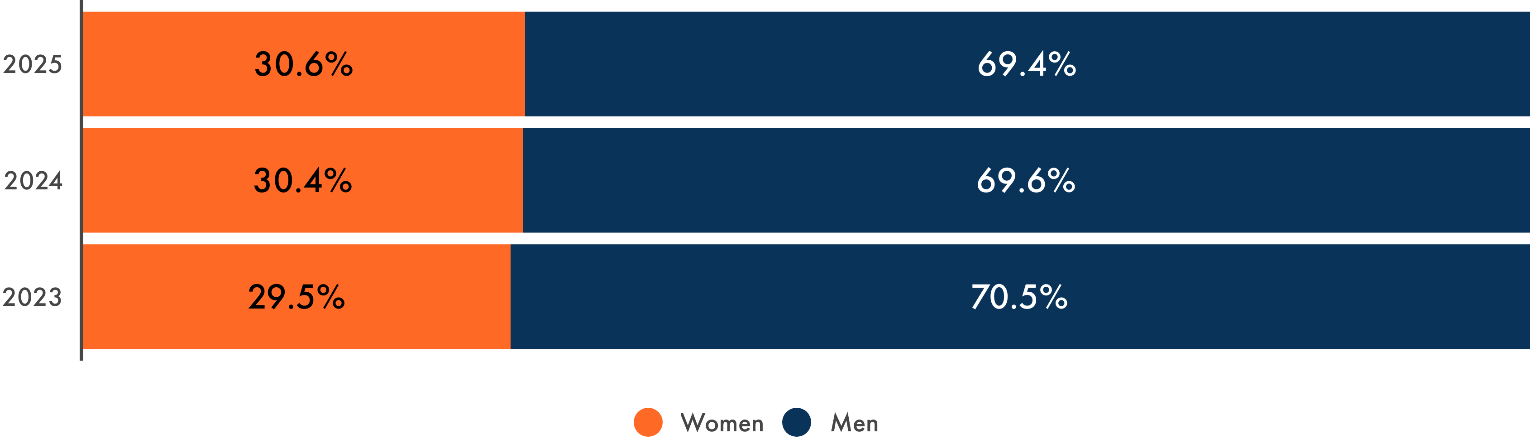
Source: Glass Lewis Research. Data as of the 2025 proxy season period of Jan. 1 to June 30, 2025.
While the number of companies that have no women on their board increased slightly over the last year compared to 2024, women generally continue to see increased representation on boards (particularly between the 31—50% thresholds), as seen in Figure 3. This is likely representative of market standards established over the years in light of increased focus in this area.
Figure 3. Percent of Women Represented on Boards of Directors
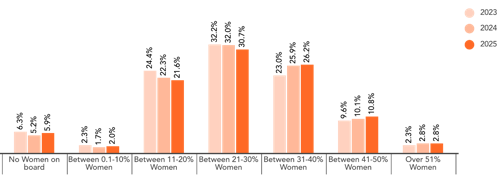
Source: Glass Lewis Research. Data as of the 2025 proxy season period of Jan. 1 to June 30, 2025.
In addition, the proportion of board leadership positions (including lead director, CEO and board/committee chair roles) held by women also increased in 2025, with the largest increase seen among chair roles.
Figure 4. Women in Board Leadership Positions
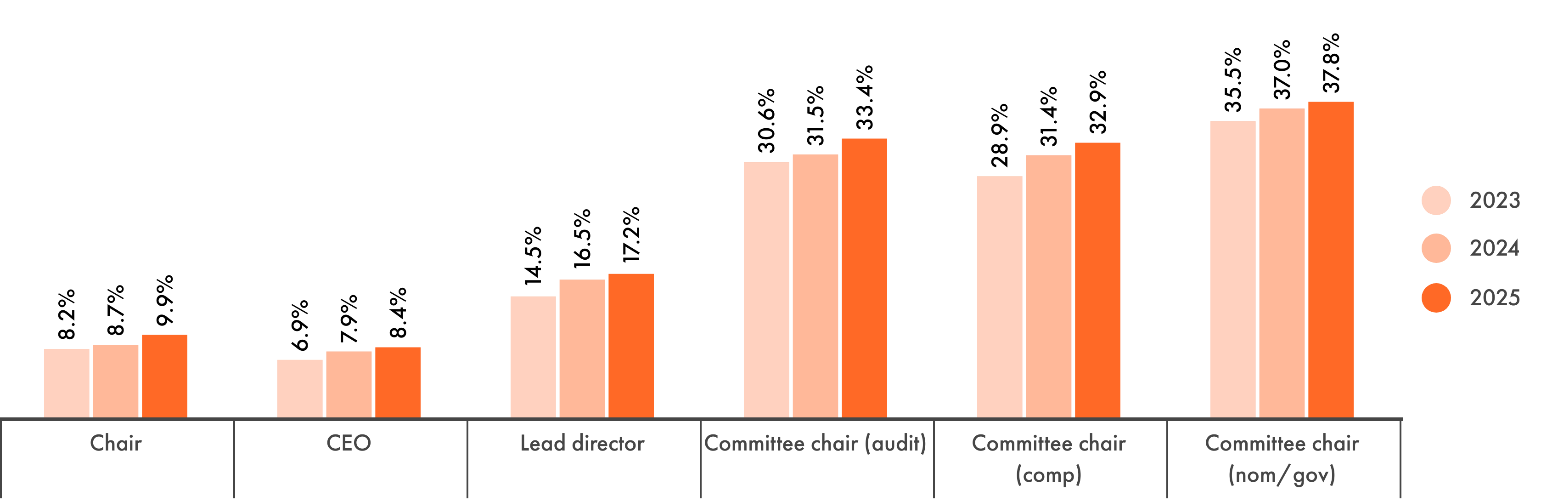
Source: Glass Lewis Research. Data as of the 2025 proxy season period of Jan. 1 to June 30, 2025.
Notably, after reaching a high of approximately 45% of first year appointments in 2021, the number of first year appointments of women directors at Russell 3000 companies has steadily declined, with 2025 being the first time that this figure has dropped below 30% (Figure 7).
Figure 5. Gender Breakdown of First Year Director Appointments Among Russell 3000 Companies
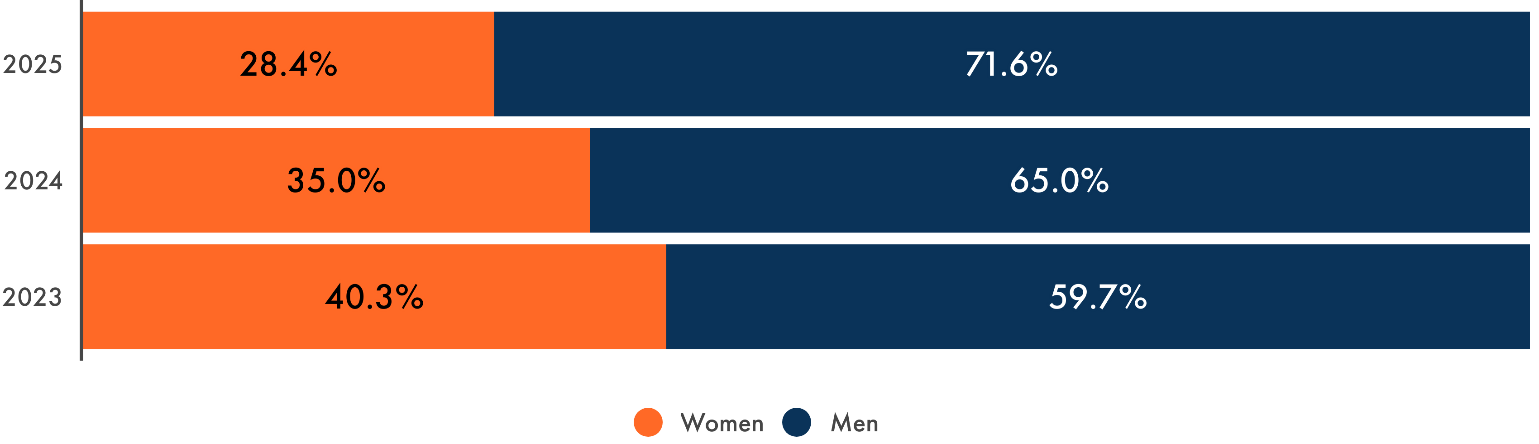
Source: Glass Lewis Research. Data as of the 2025 proxy season period of Jan. 1 to June 30, 2025.
This year’s rate of 28.4% gender diverse, first year appointments represents a nearly 30% decrease from 2023. The downward trend may be due in part to the December 2024 overturning of the Nasdaq board diversity rules,4 which previously required Nasdaq-listed companies to have a certain number of diverse directors, including at least one woman; or explain why they do not.
Racial and Ethnic Diversity and Related Disclosures
In light of recent regulatory developments, we observed a decrease in the number of companies that provided board racial/ethnic demographic disclosure. Many U.S. companies revised their disclosures of board diversity in light of the landmark June 2023 Supreme Court decision,5 the current U.S. Administration’s pronounced shift in its approach to diversity, equity and inclusion (DEI) programs,6 and changing investor expectations.
In addition, companies are no longer required to disclose Nasdaq diversity matrices following the U.S. Court of Appeals for the Fifth Circuit’s December 2024 decision to strike down the rule requiring companies listed on the Nasdaq exchange to meet certain diversity disclosure requirements.7
Among companies that provided this disclosure, board racial/ethnic diversity continued to slightly increase, with companies in the S&P 500 and Russell 1000 increasing to 26.3% and 24.8%, respectively, as shown in Figure 6.
Figure 6. Average Board Racial/Ethnic Diversity
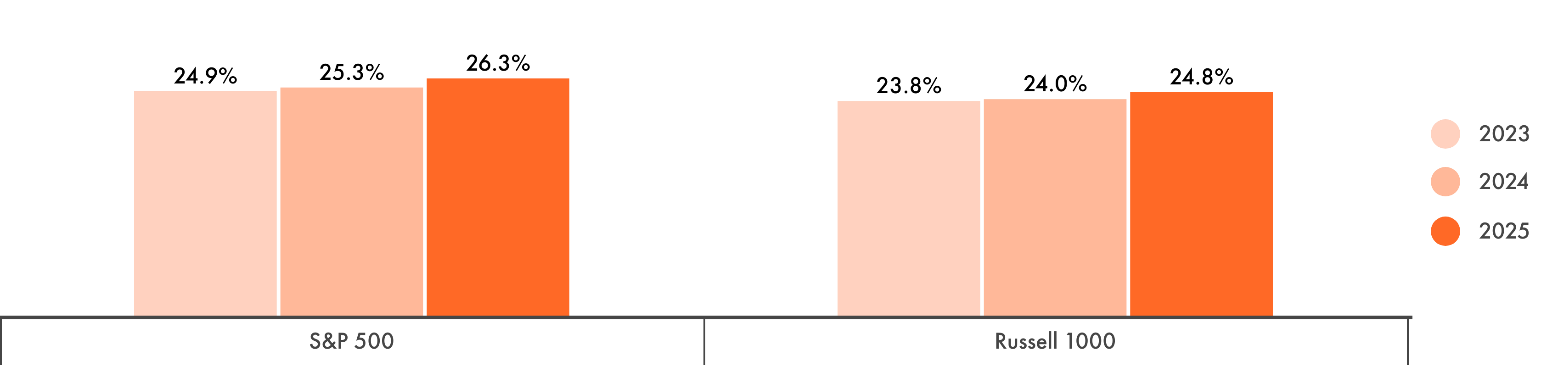
Source: Glass Lewis Research. Data as of the 2025 proxy season period of Jan. 1 to June 30, 2025.
The impact of a smaller pool of companies reporting can also be seen in the decline in the percentage of Russell 1000 companies with no board racial/ethnic diversity, which dropped from 1.7% to just 0.3% (Figure 7).
Figure 7. Board Racial/Ethnic Diversity Breakdown Among Russell 1000 Companies
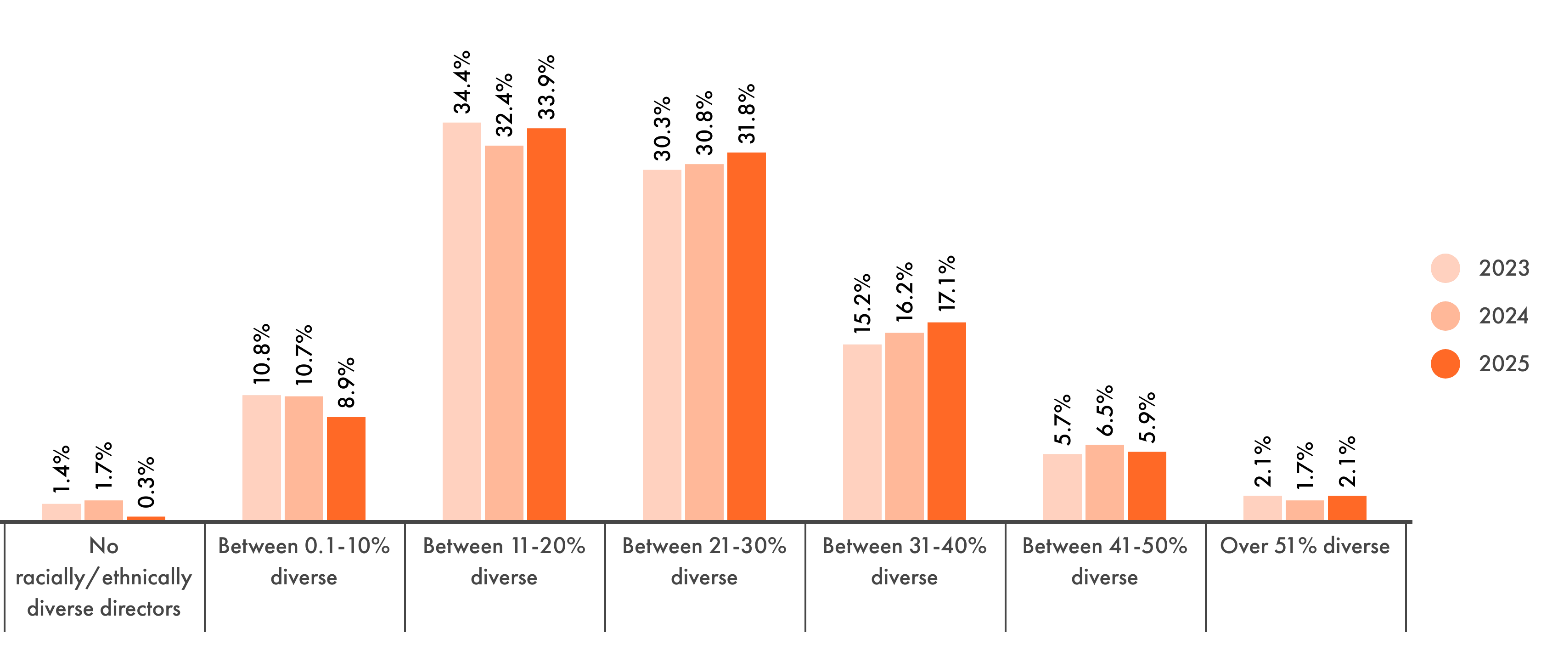
Source: Glass Lewis Research. Data as of the 2025 proxy season period of Jan. 1 to June 30, 2025.
Evolving Shareholder Sentiment
In addition to a shifting regulatory environment, declines in gender diversity among new appointments and reporting of racial and ethnic diversity may also reflect evolving shareholder sentiment.
The results of our 2025 Policy Survey, conducted after the proxy season, indicate that U.S. investors are taking a contextual, holistic approach to diversity, with some noting that they had moved away from employing specific thresholds “given the current market conditions,” and 42% reporting that they do not evaluate boards based on any diversity factors (compared to just 6% among investors form other regions).8
When we asked participants what board diversity disclosures they expected companies to provide in their proxy statement, 100% of U.S. investors cited information on the board's approach to considering diversity in director nominations, and 94.1% look for board skills disclosure. By contrast, just 23.5% of U.S. investors expect board racial/ethnic diversity to be disclosed, and just 17.6% expect a “Rooney Rule” to be in place for board appointments.9
Notes and References
1 Covering the period from January 1 through June 30, 2025.
2 Glass Lewis. 2025. 2025 Policy Survey Results. Accessed Nov. 1, 2025. https://grow.glasslewis.com/2025-policy-survey-results
3 Glass Lewis. 2025. 2025 U.S. Benchmark Policy Guidelines. Pages 9-11. Accessed Nov 1, 2025. https://resources.glasslewis.com/hubfs/2025%20Guidelines/2025%20US%20Benchmark%20Policy%20Guidelines.pdf
4 Raymond, N. Reuters. 2024. “US appeals court tosses Nasdaq board diversity rules.” December 12, 2024.
https://www.reuters.com/legal/us-appeals-court-tosses-nasdaq-board-diversity-rules-2024-12-11/
5 Hayes, B. 2024. Directors & Boards. “After a 2023 Ruling, DEI No Longer Reigns Supreme.” November 6, 2024. https://www.directorsandboards.com/board-issues/dei/after-a-2023-ruling-dei-no-longer-reigns-supreme/
6 The White House. 2025. Ending Radical And Wasteful Government DEI Programs And Preferencing. January 20, 2025. https://www.whitehouse.gov/presidential-actions/2025/01/ending-radical-and-wasteful-government-dei-programs-and-preferencing/
7 Raymond, N. “US appeals court tosses Nasdaq board diversity rules.”
8 Glass Lewis. 2025 Policy Survey Results.
9 The Rooney Rule is a National Football League policy that requires league teams to interview external diverse candidates for head coaching and senior football operation jobs. https://resources.glasslewis.com/hubfs/Supplementary%20Guidance/Glass-Lewis-Approach-to-Diversity-Disclosure-Ratings.pdf