
Glass Lewis Pay for Performance Scores – Test Breakdown

Overall Score
Performance against each test in our scorecard results in points being added to the overall alignment score for your company. An overall score and concern level are generated based on the final result.
- Severe Concern: 0 to 20 points
- High Concern: 21 to 40 points
- Medium Concern: 41 to 60 points
- Low Concern: 61 to 80 points
- Negligible Concern: 81 to 100 points
About the Tests
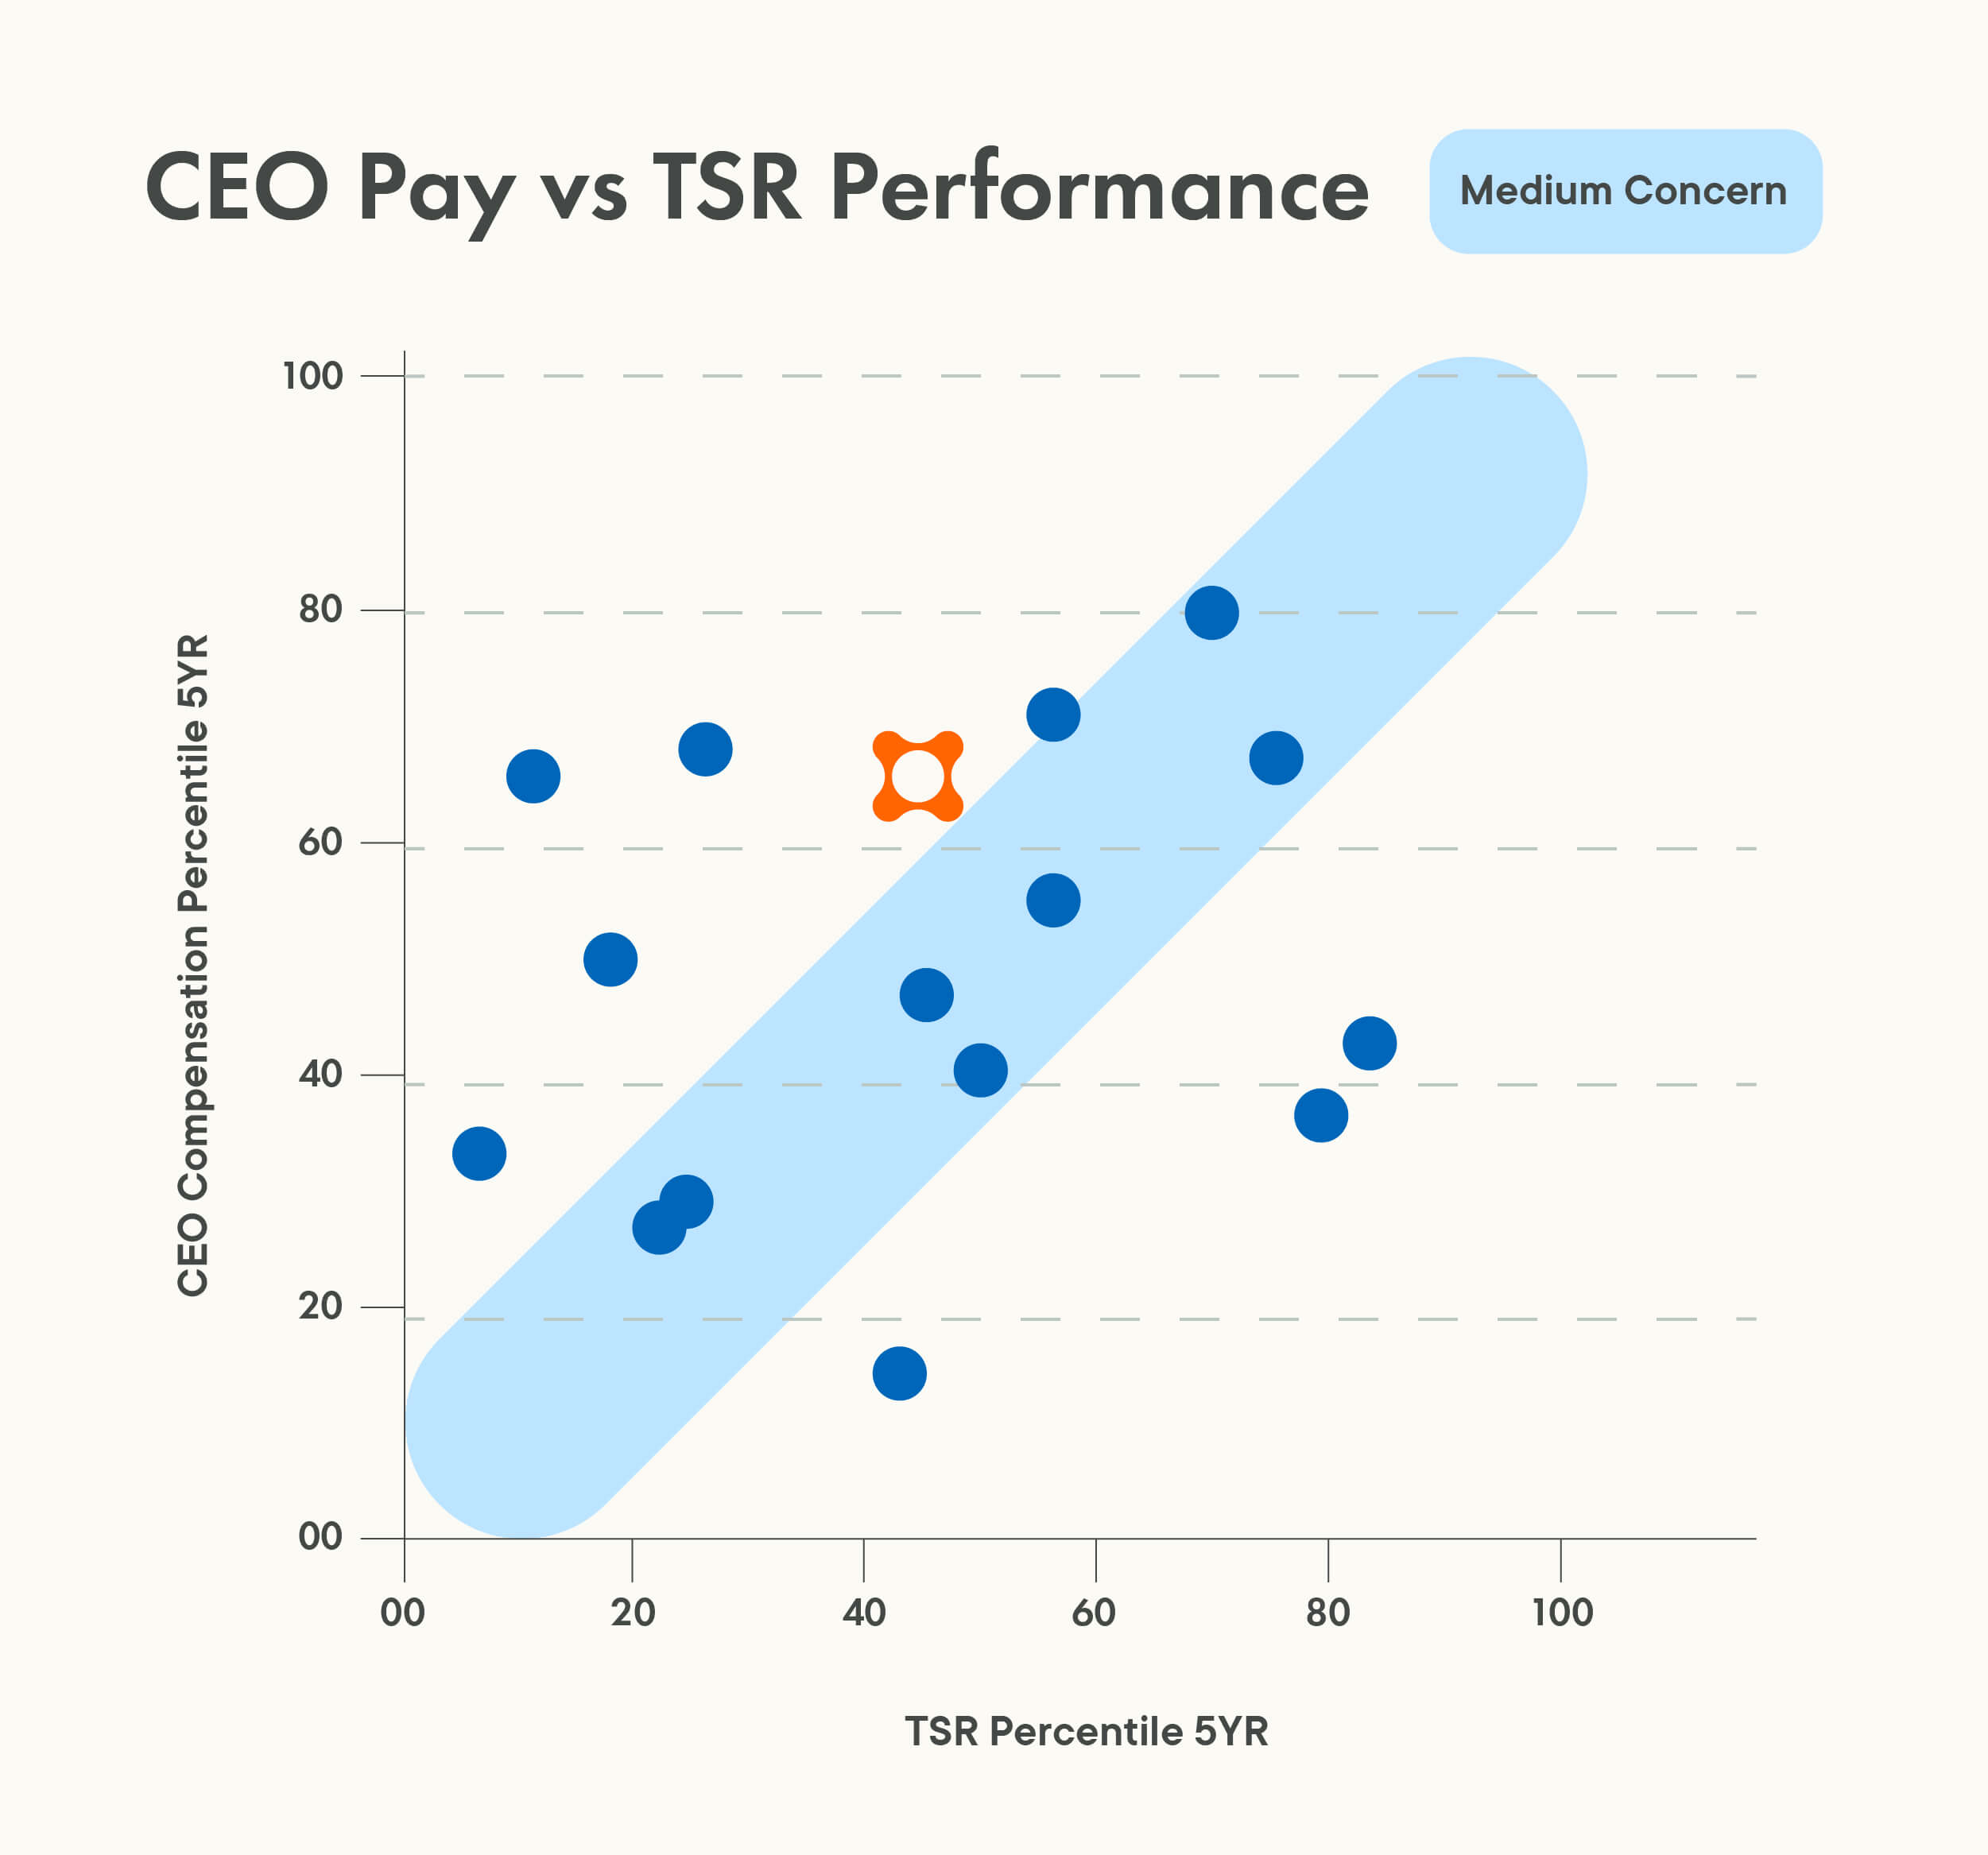
Granted CEO Pay vs. TSR
- Relative compared to Glass Lewis peers.
- Five-year weighted average measurement period (three years minimum)
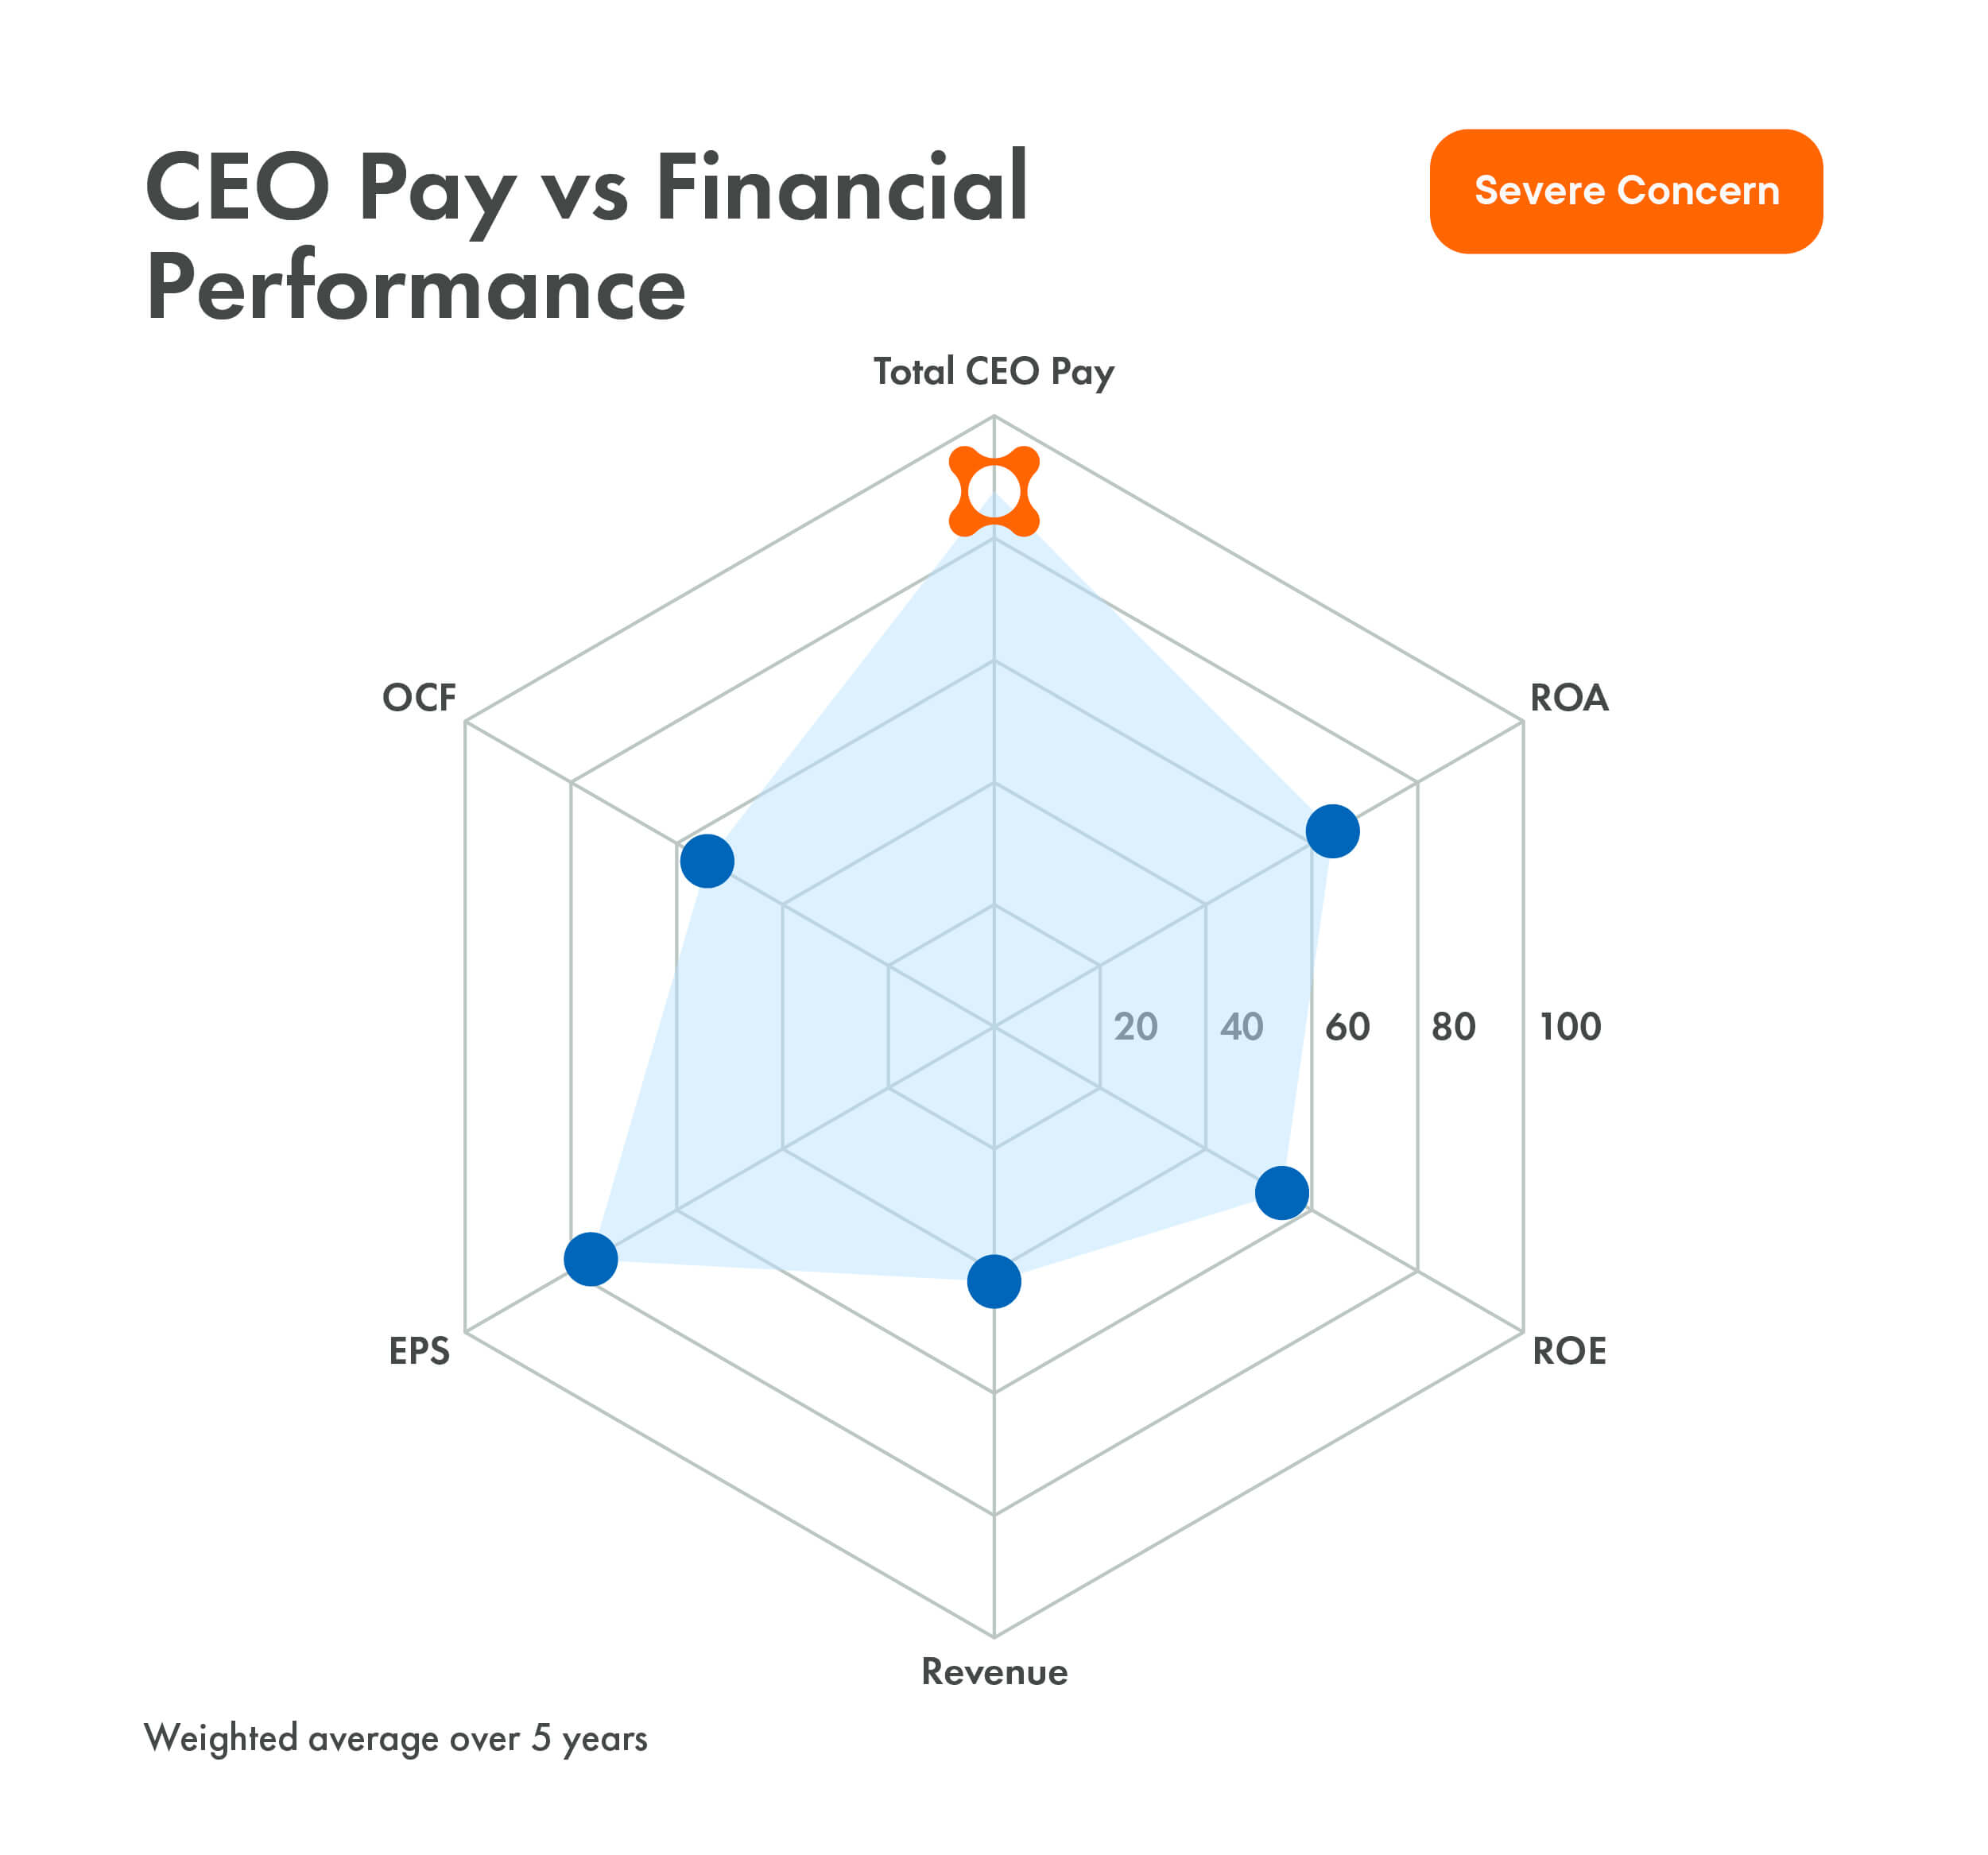
Granted CEO Pay vs. Financial Performance
- Relative compared to Glass Lewis peers.
- Five-year weighted average measurement period (three years minimum)
- See Performance Metrics section for full list.
CEO STI Payouts vs. TSR
- Relative to general market-based benchmarks.
- Measured over five one-year periods and averaged.

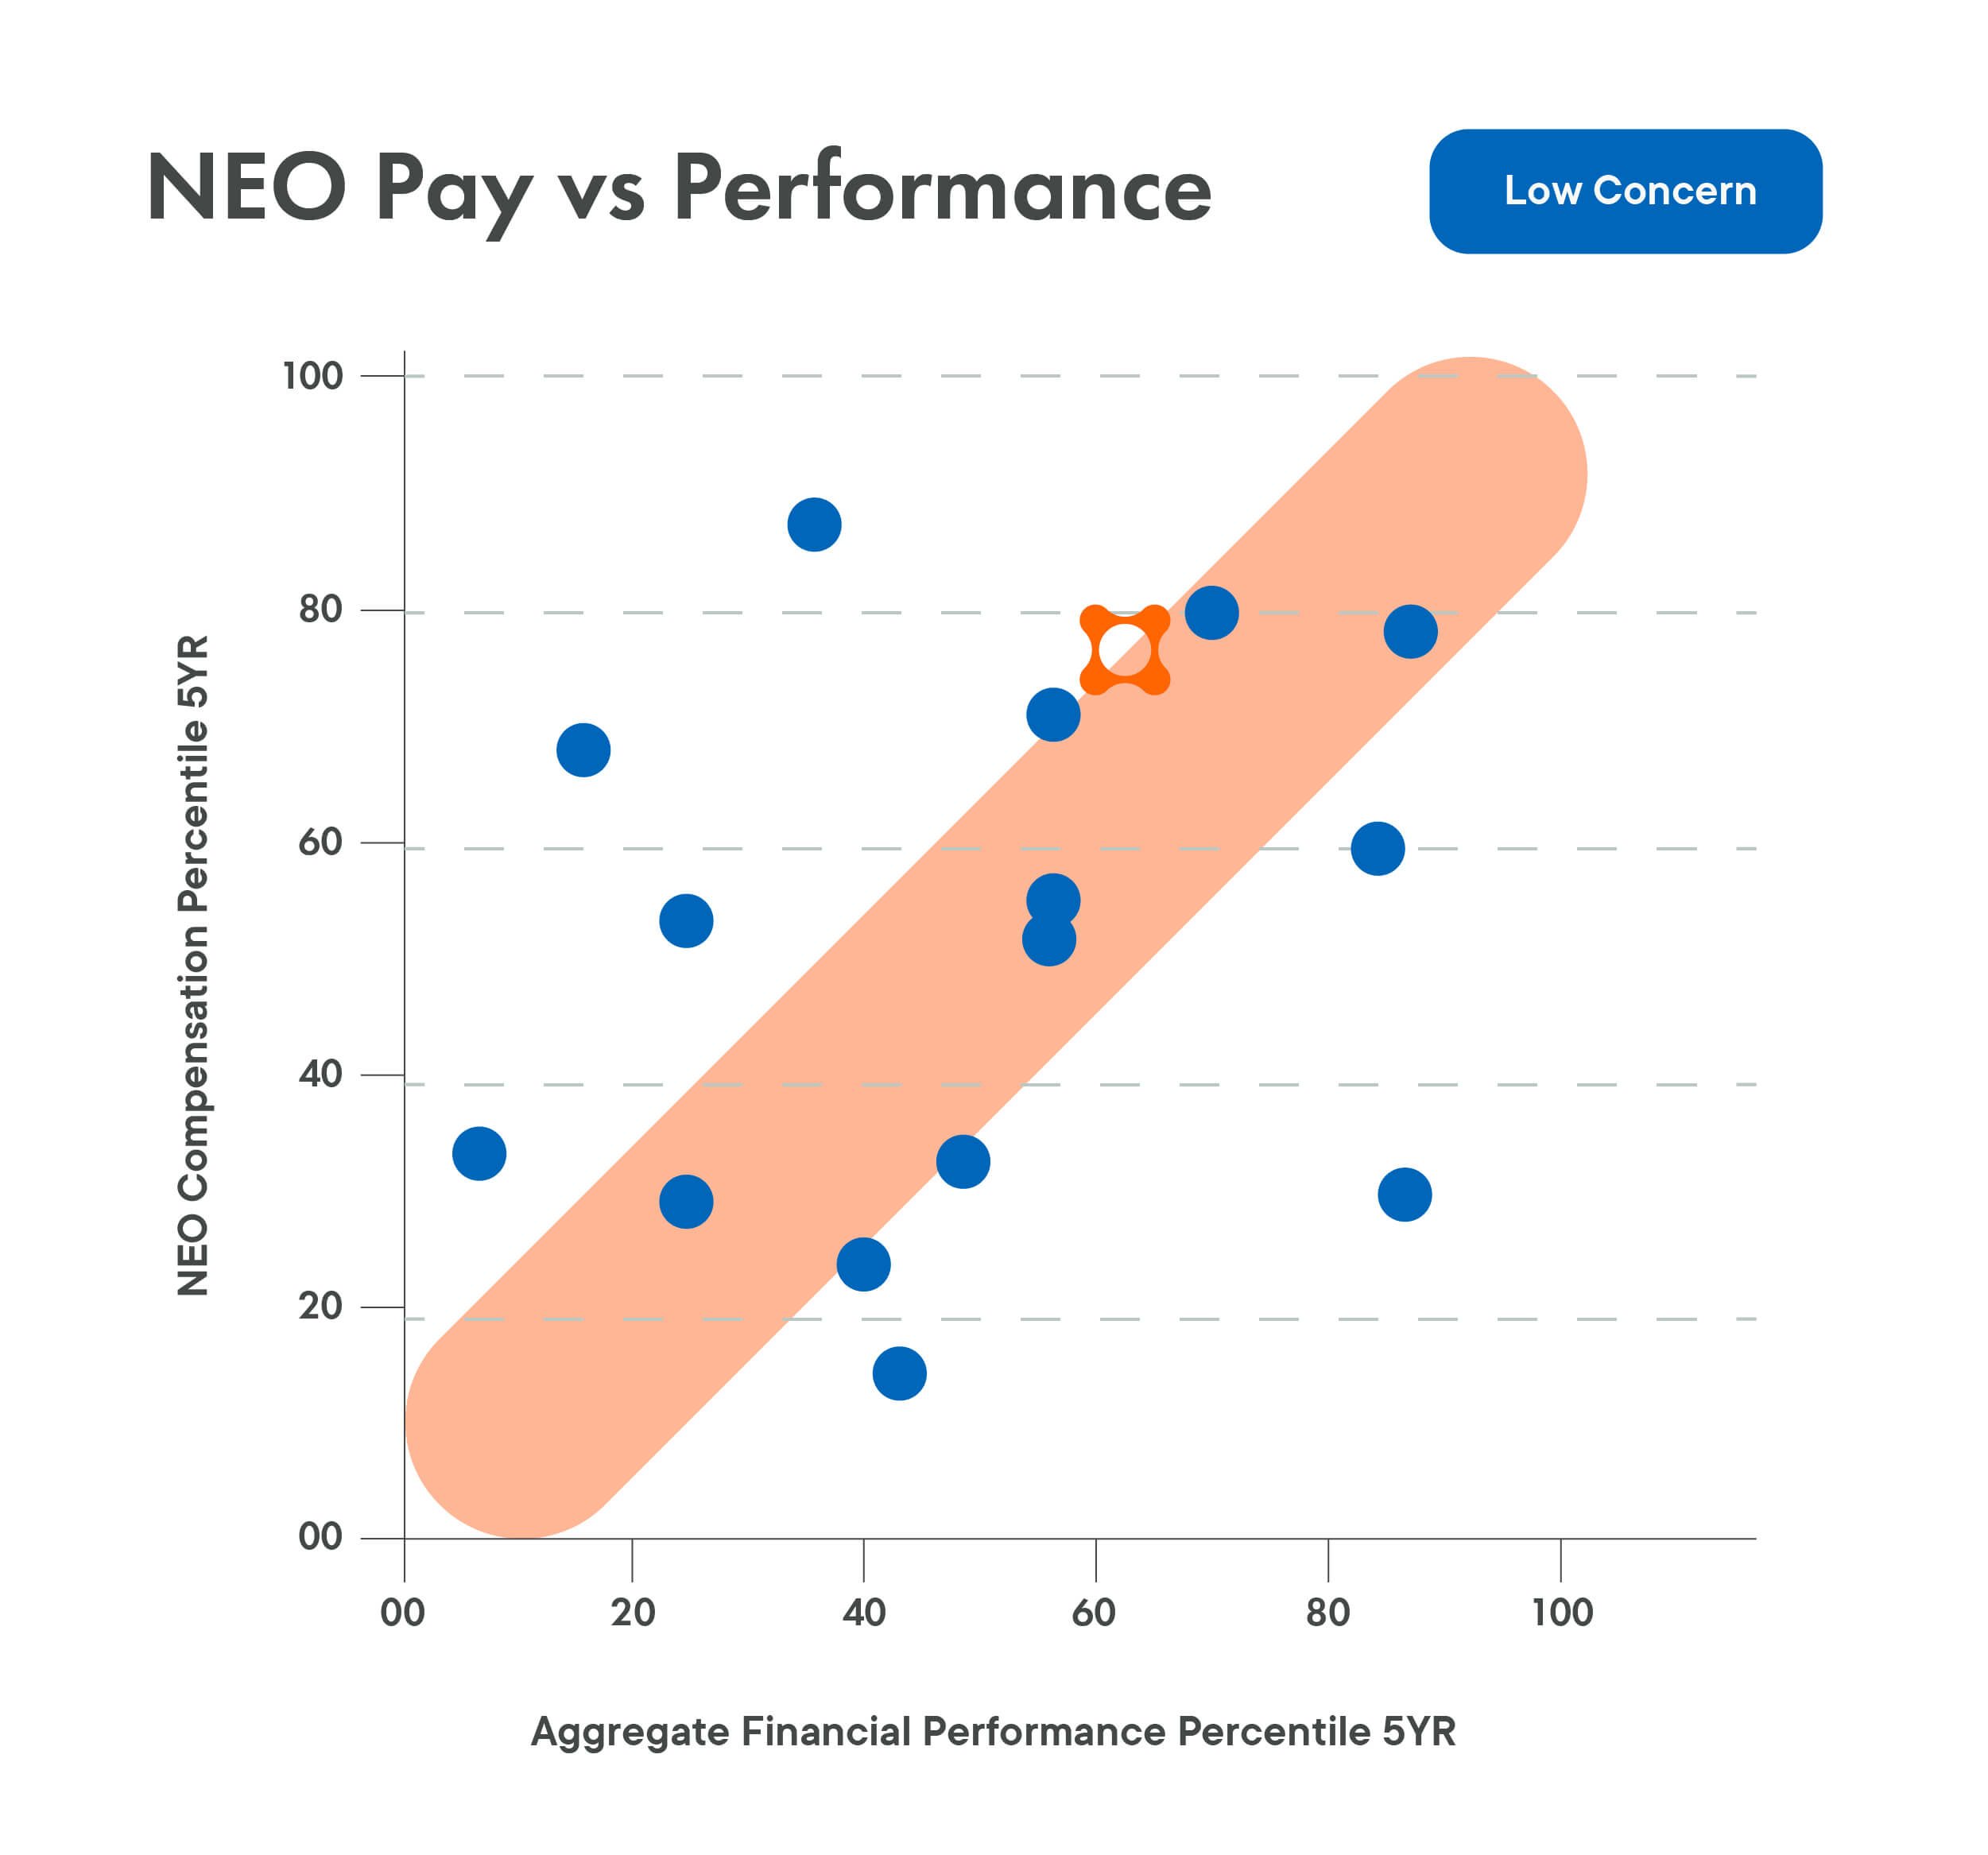
Total Granted NEO Pay vs. Financial Performance
- Relative compared to Glass Lewis peers.
- Five-year weighted average measurement period (three years minimum)
- See Performance Metrics section for full list.
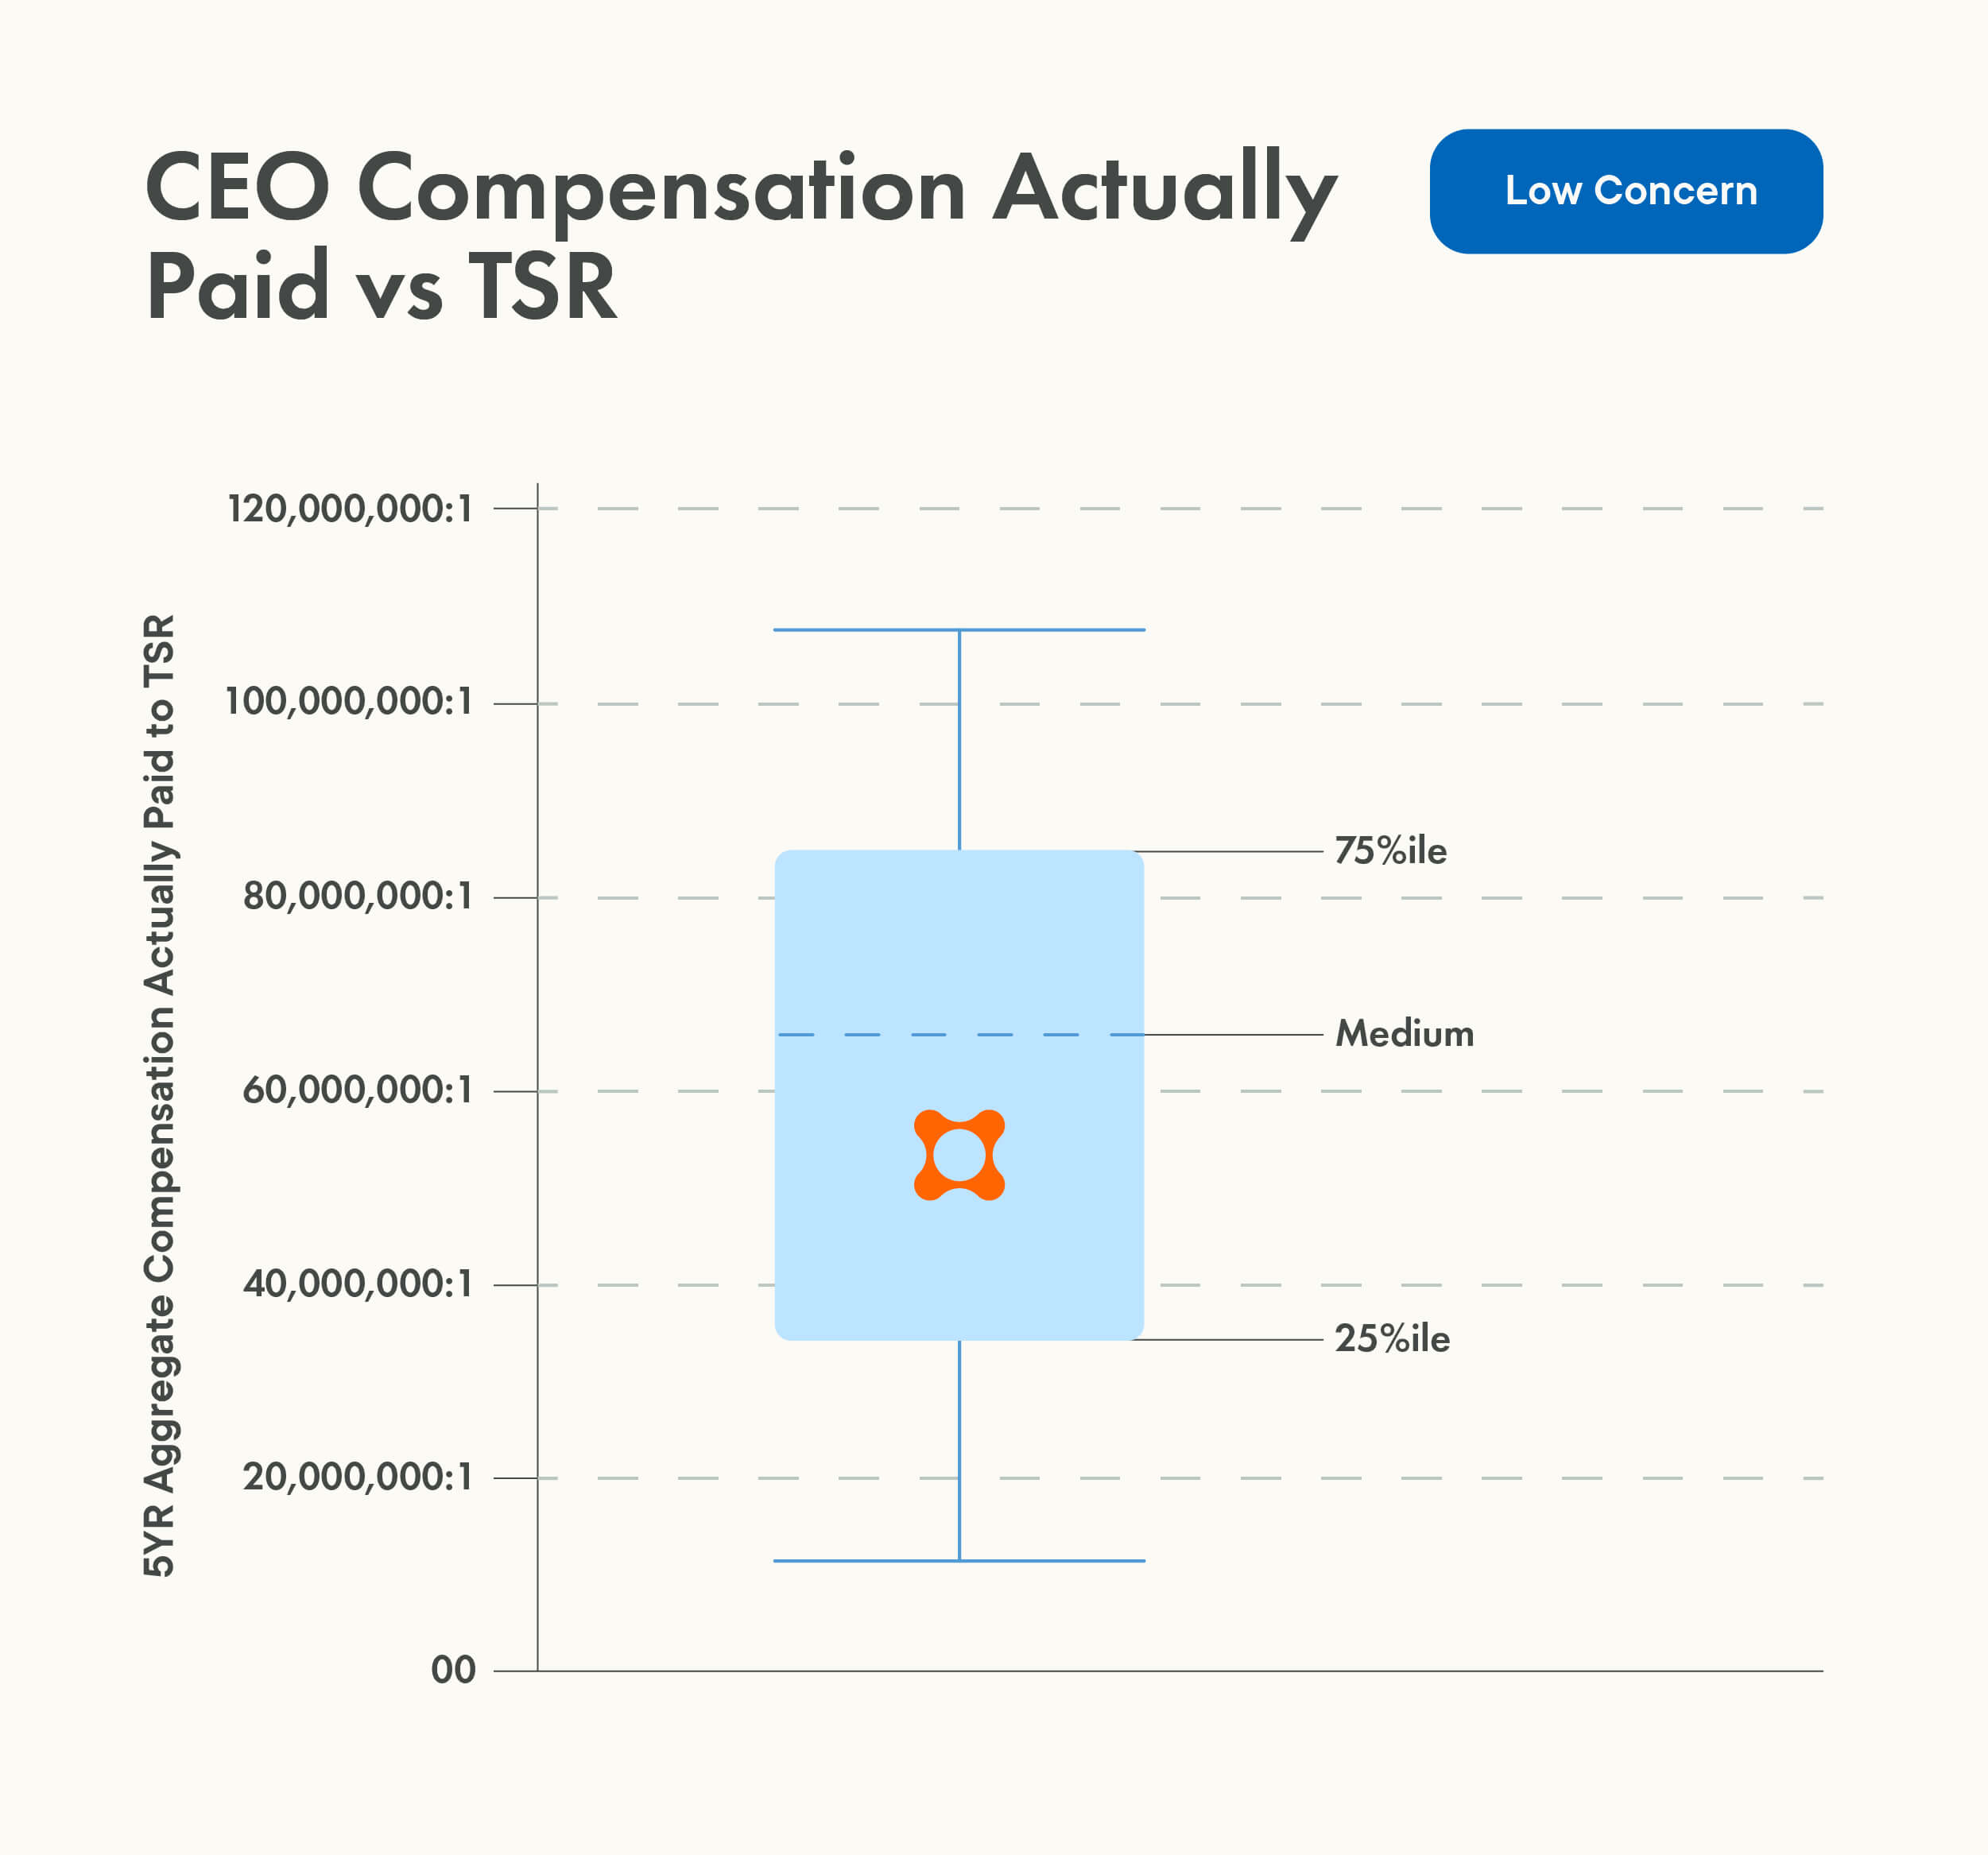
US - CEO Compensation Actually Paid (“CAP) vs. TSR
- Ratio of five-year aggregate CEO CAP and TSR ranked against market capitalization peers.
- Aggregate of five-year CEO CAP and the reported five-year cumulative TSR (based on Pay versus Performance disclosure as mandated by the SEC)
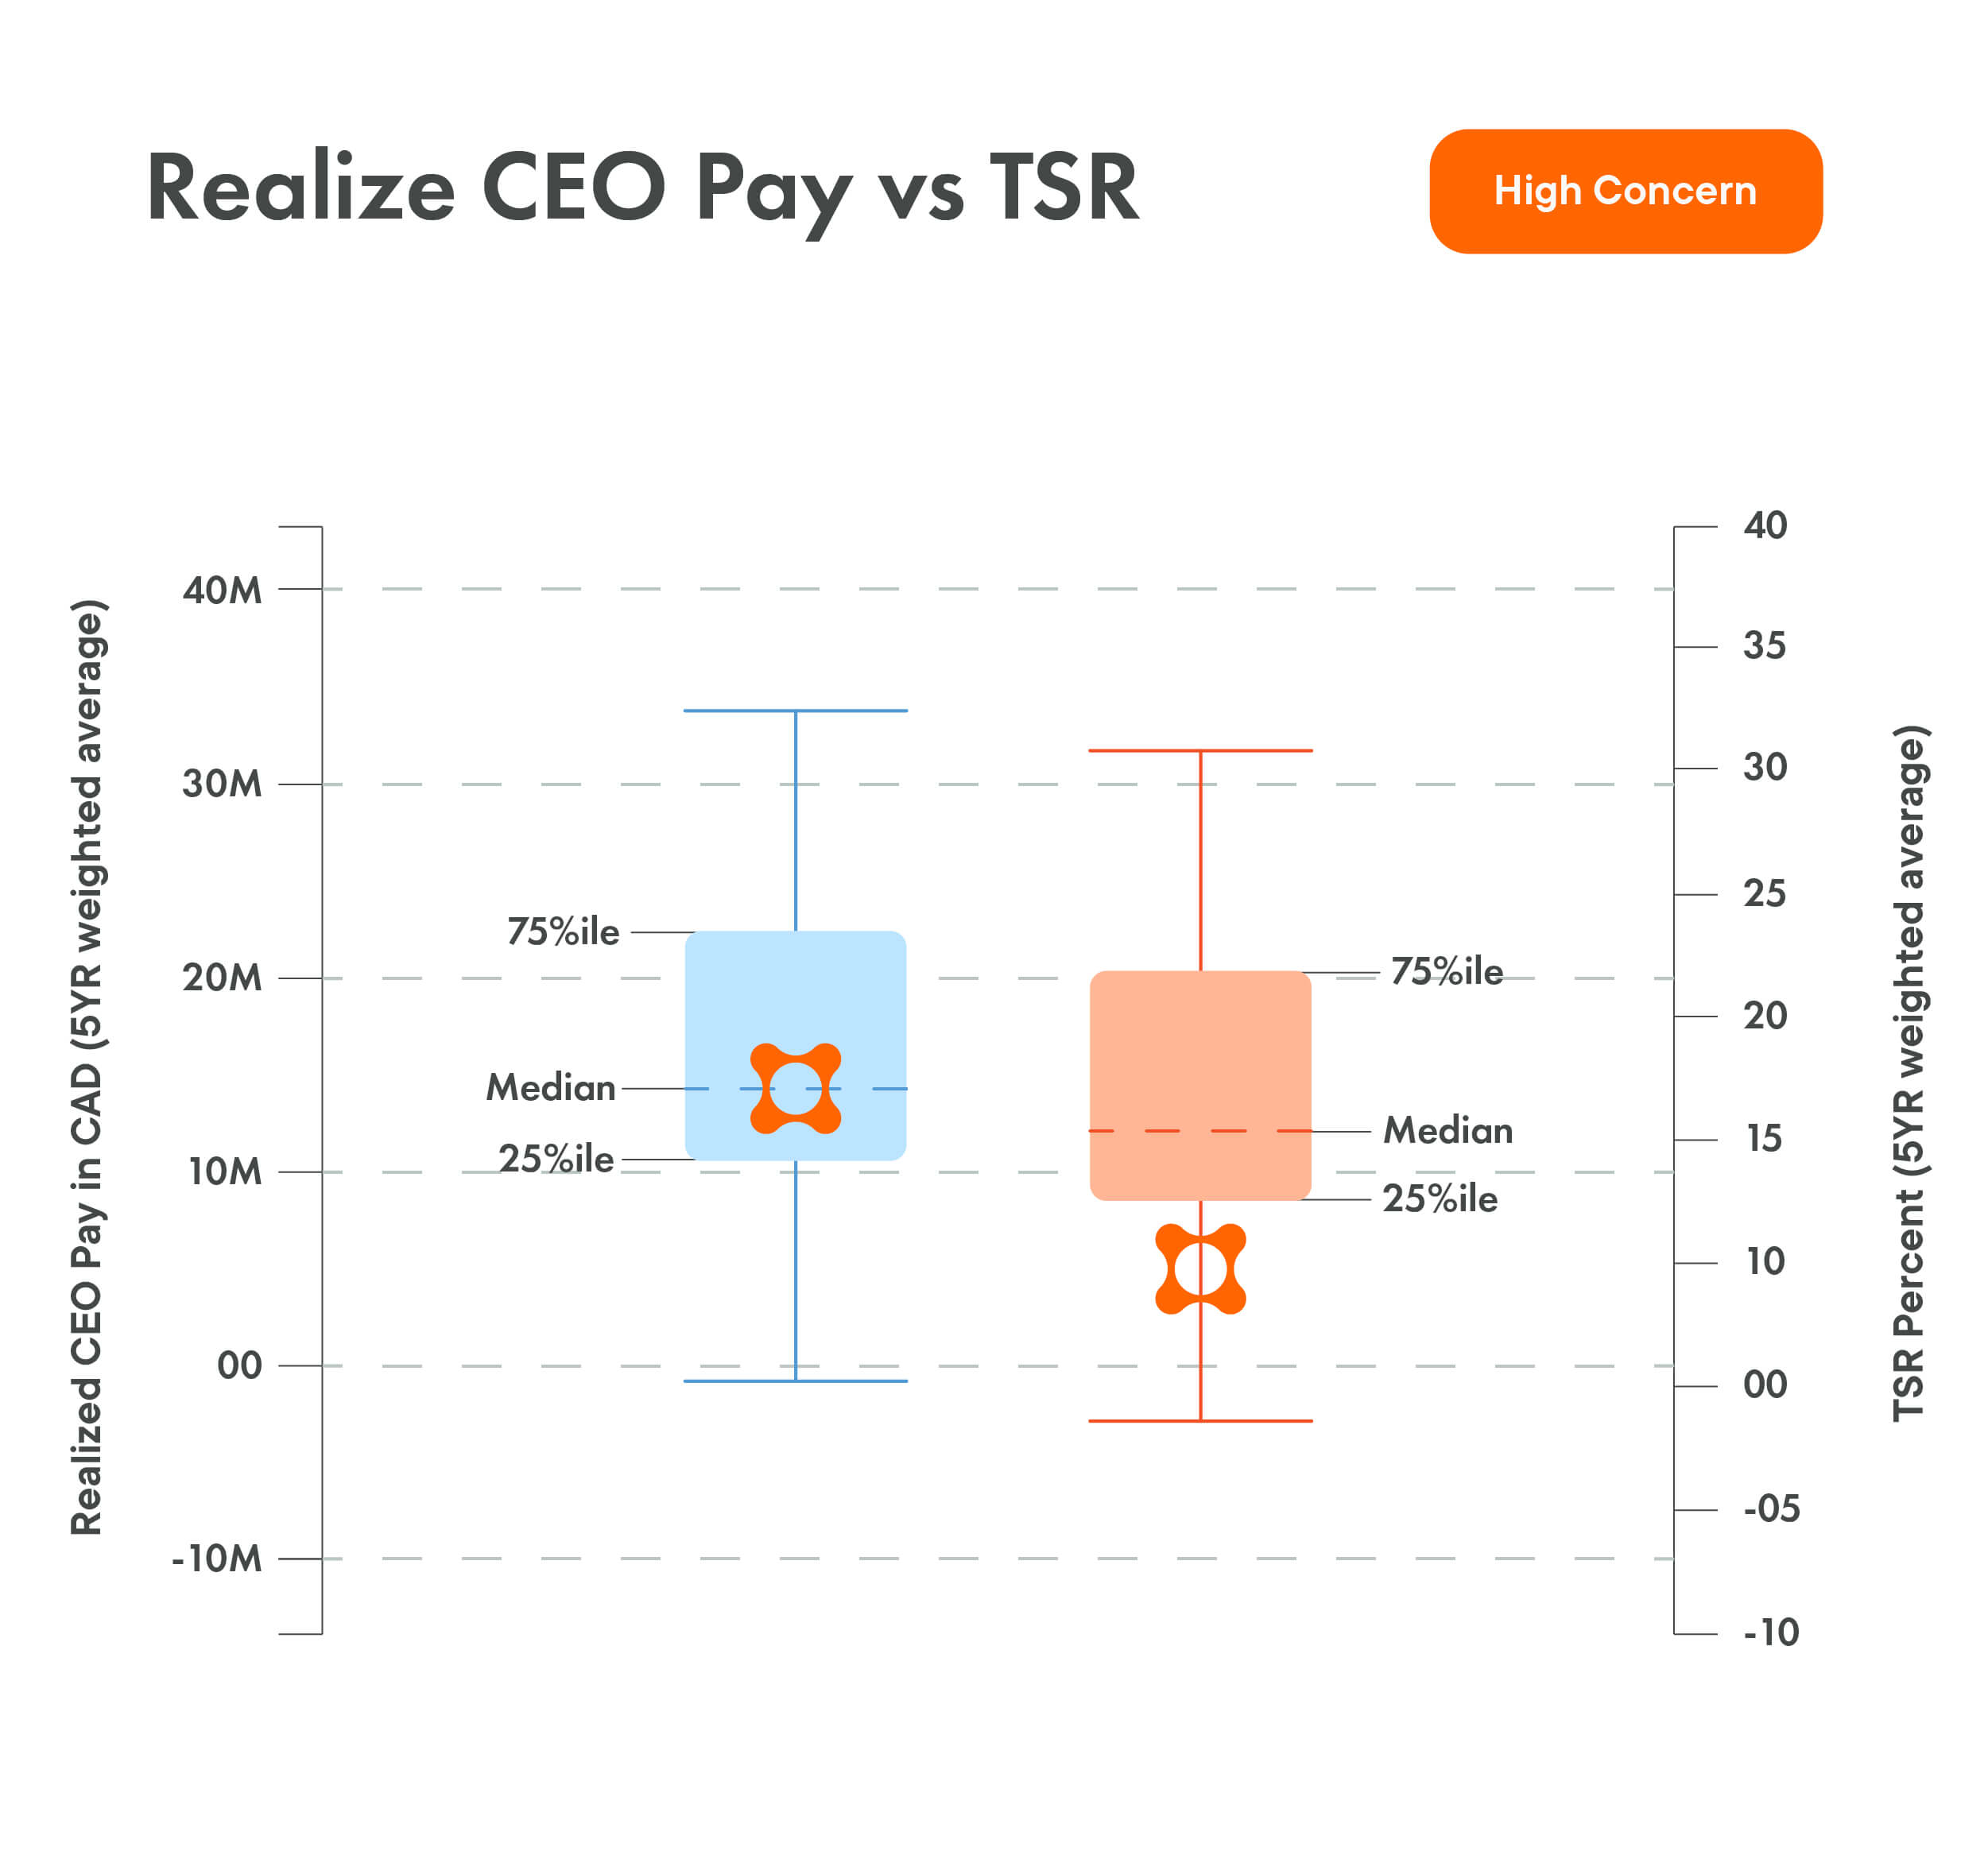
CAN - Realized CEO Pay vs. TSR
- Relative to Glass Lewis peers
- Five-year weighted average measurement period (three years minimum)
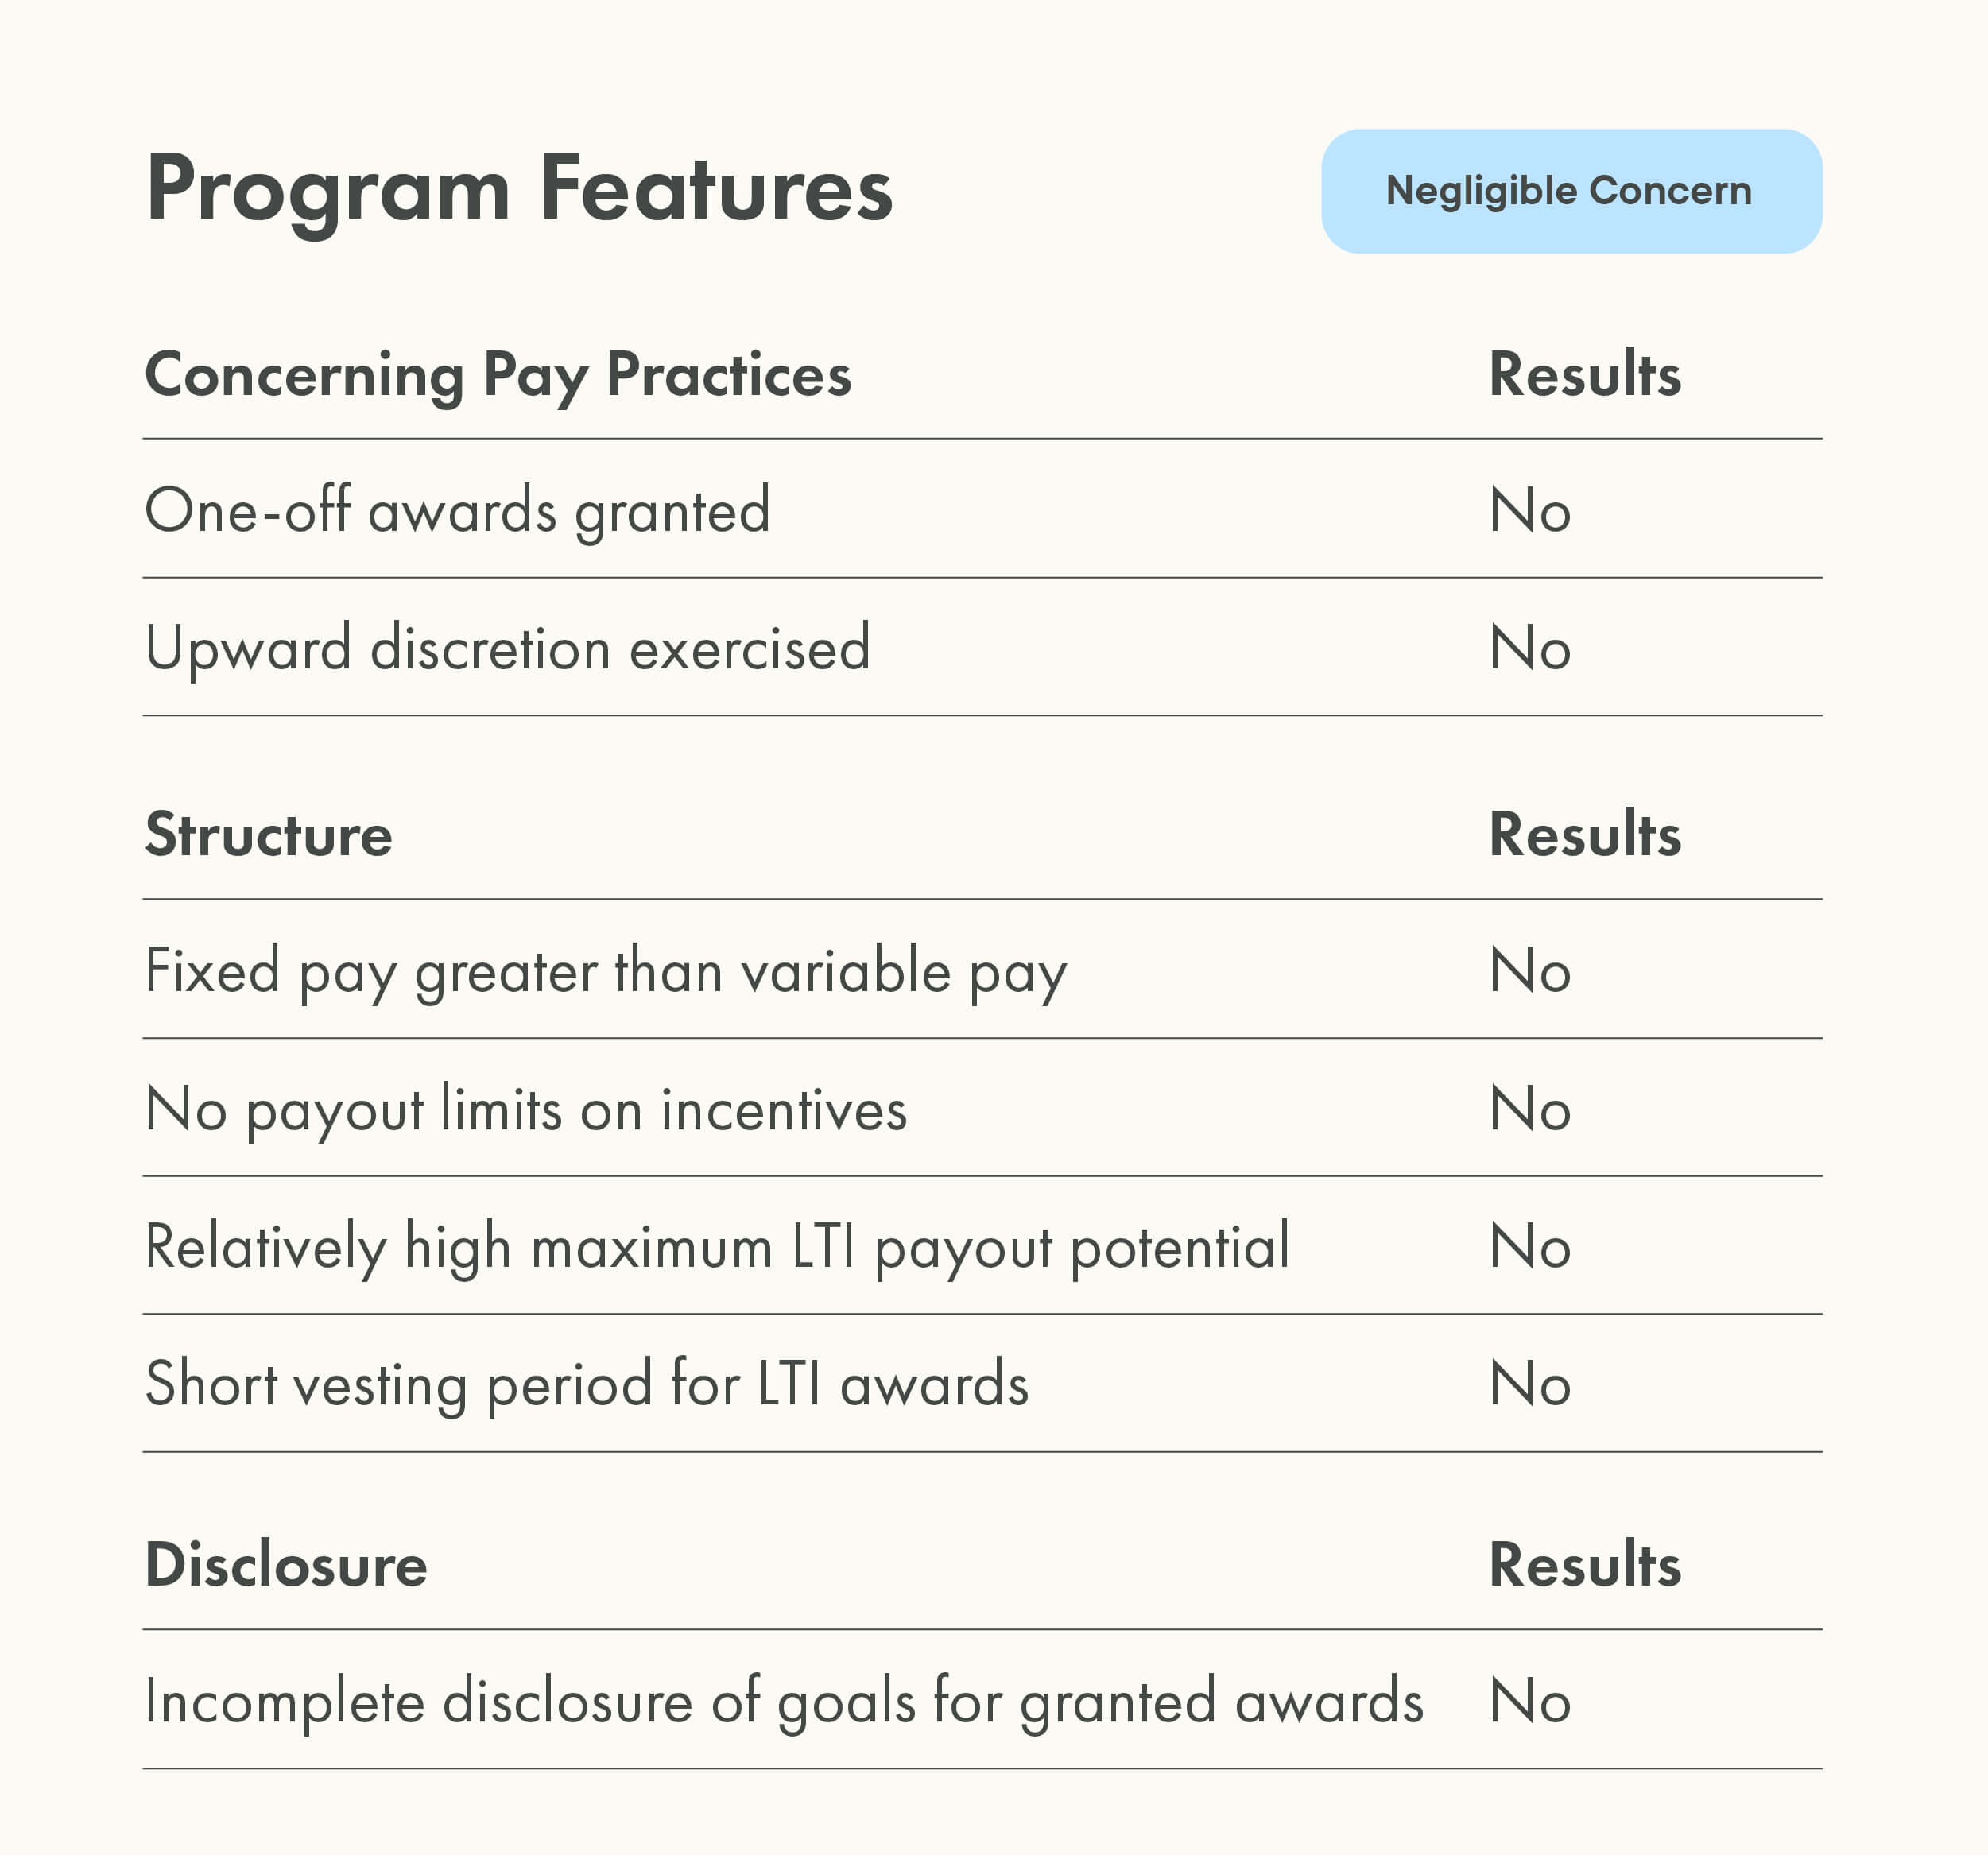
Qualitative Test
- Any one-off awards granted?
- Any upward discretion exercised?
- Is fixed pay greater than variable pay?
- Are incentives unlimited/ not disclosed?
- Is maximum LTIP payout potential excessive?
- Is there a short vesting period for LTIs?
- Any upward discretion exercised?
Performance Metrics
The pay-for-performance model evaluates five indicators of business performance:
- All sectors metrics: Revenue growth, return on equity and return on assets
Sector-specific metrics:
- Banks/Financials/Mortgage REITs (excluding payment systems GICs): Annualized TBV per share and EPS growth
- Most equity REITs and specialized REITs (excluding timber REITs and communication tower REITs): FFO growth and operating cash flow growth
- All other sectors: EPS growth and operating cash flow growth